
Stocks fell 8.6% in a week. Bonds still price December's Fed hike.
The S&P 500 lost 8.6% in a week. The 2-year Treasury fell 25 basis points and the 3-month bill didn't move: relief priced for 2027, none for December.
By the numbers
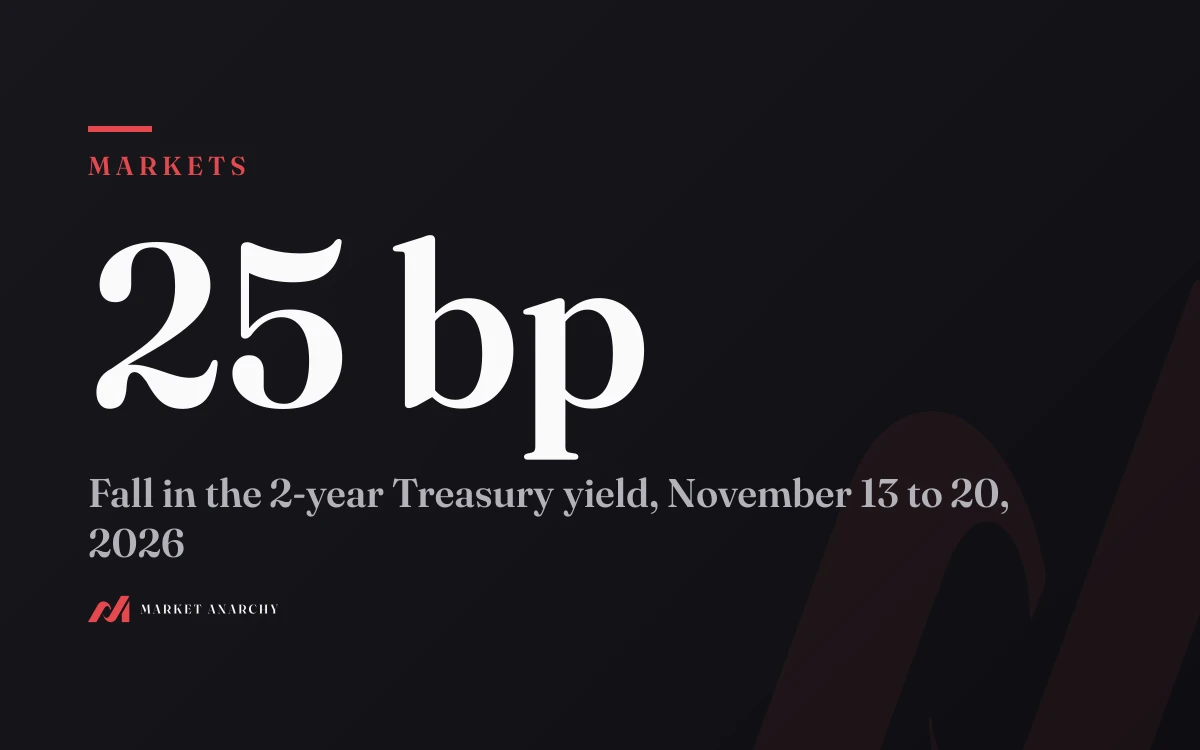
25 bpfall in the 2-year Treasury yield, November 13 to 20, 2026
0 bpchange in the 3-month bill over the same week, still 4.32%
8.6%S&P 500 loss in the week to November 20
3.88%effective federal funds rate before the December 9 decision
The S&P 500 lost 8.6% in the week to Friday, November 20, 2026, and the bond market did not price a Fed rescue for December. The 3-month Treasury bill ended the week at 4.32%, exactly where it started, according to Treasury's daily yield curve. Futures put the odds of a quarter-point hike on December 9 at about 92% on Friday, CNBC reported, up from 88.8% after the October inflation report, per Investing.com.
The relief went further out. The 2-year yield fell 25 basis points in five sessions, from 4.88% to 4.63%. The 10-year fell 23, from 5.15% to 4.92%. Our read: traders took roughly one quarter-point hike out of the Fed's path for 2027 and left December's alone.
That matters if you hold cash, if you're waiting to lock a yield, or if you expected the Fed to stop hiking because stocks fell.
What happened to stocks in the week of November 16
The S&P 500 closed at 7,561.67 on November 13, the AP reported. It closed at 6,910.39 on November 20, after a 3.7% drop on Friday alone, its seventh losing session in a row (Noctaaa daily brief, November 21). That's an 8.6% loss for the week. The Nasdaq Composite fell 10%, its worst week since March 2020, and closed below where it began 2026 (USPress weekly update).
Chips led it down. Nvidia fell 14% on Friday to $125.53 on 633 million shares, almost four times its usual volume (Motley Fool market data), after Reuters reported that SEC enforcement staff are examining potential accounting issues at the company (Reuters via Investing.com). It was the stock's seventh straight weekly loss, the longest run since 2008 (CNBC).
What the yield curve did, maturity by maturity
The bond market didn't move as one block. The short end sat still and the middle moved most.
4 bp14 bp25 bp23 bp16 bp
View as table
| label | Fall in Treasury yields, November 13 to 20, 2026 |
|---|---|
| 3-month bill | 0 bp |
| 6-month bill | 4 bp |
| 1-year | 14 bp |
| 2-year | 25 bp |
| 10-year | 23 bp |
| 30-year | 16 bp |
These are Treasury's own par yields. The 6-month bill went from 4.42% to 4.38%, the 1-year from 4.65% to 4.51%, the 30-year from 5.47% to 5.31% (Treasury yield curve). The Fed's own H.15 release shows the same November 13 starting points: 4.88% on the 2-year, 5.15% on the 10-year (Federal Reserve H.15).
A bill that matures in three months covers the December 9 decision and little else. It didn't budge. A 2-year note covers every meeting through late 2028. It fell a quarter point. So the market kept paying for December and cut what it expects after that.
Why the Fed is still expected to hike in December
Inflation is the reason, and the stock market doesn't change it. Consumer prices rose 0.4% in October after 0.6% in September, and core prices rose 0.3%, the Bureau of Labor Statistics reported on November 10. There's no official 12-month figure for October: the BLS collected no data in October 2025 during the shutdown. September's yearly rate was 3.7%.
The Fed raised its target range to 3.75% to 4% in September and held there on October 28, with two officials, Lisa Cook and Beth Hammack, voting for another quarter point (FOMC statement). On November 18, Governor Christopher Waller told CNBC the Fed may need a half-point hike in December, or a clear signal of another in January. "You might need to, like, shock people," he said (CNBC).
A falling stock market loosens nothing for the Fed while monthly inflation runs at 0.4%. Bills are priced for that. The 3-month bill at 4.32% sits 44 basis points over the 3.88% effective funds rate. That gap holds the December hike and part of another.
What the 25 basis points on the 2-year mean
This part is our reading of the data, and it's an estimate. A 2-year yield is an average of the overnight rates traders expect over two years, plus a small premium. If it falls a quarter point while the next three months stay put, the expected path further out fell by more than a quarter point. That's about one hike's worth, removed from 2027.
Two explanations fit, and the week doesn't separate them:
- Slower growth ahead. A 10% drop in the Nasdaq cuts household wealth and makes companies borrow less. That does part of the Fed's work for it in 2027.
- A plain flight to safety. Money leaving stocks bought Treasuries. LPL's Lawrence Gillum told CNBC "the safe-haven bid is clearly alive and well." That demand can reverse as fast as it came.
If it's the first, the 2-year stays lower. If it's the second, a calm week for stocks gives the 25 basis points back.
What to do with this if you hold cash or bonds
Cash in bills or money funds still earns the same. The 3-month yield didn't fall, and a December hike would lift it. Our guide to T-bills versus savings accounts, kept current, shows what that yield nets after state tax.
Anyone waiting to lock a longer yield paid for waiting. A 2-year note bought on Friday yields a quarter point less than one bought a week earlier. On $50,000, that's about $125 a year for two years.
The 10-year is back under 5%. It was 5.15% on November 13, close to the 2007 high we tracked last week. Mortgage rates follow the 10-year more than the Fed, so a lower 10-year can ease borrowing costs even if the Fed hikes on December 9.
What to watch before December 9
- Any jobs or inflation data released before the meeting. Another 0.4% monthly CPI print would make a half-point hike likelier than the futures show.
- Whether the 2-year holds below 4.70%. A bounce back toward 4.88% says Friday was flight to safety.
- The Fed's dot plot on December 9. It's the first official forecast since the selloff. Fewer dots for 2027 would confirm what the 2-year already priced.
Sources
- US Treasury, daily par yield curve rates, 2026
- Federal Reserve, H.15 Selected Interest Rates, November 20, 2026
- Federal Reserve, FOMC statement, October 28, 2026
- Bureau of Labor Statistics, Consumer Price Index, October 2026
- CNBC, Treasury yields sharply lower as investors flee to safe havens, November 20, 2026
- CNBC, Waller says the Fed may need to shock people with a half-point hike, November 18, 2026
- CNBC, Nvidia's seven-week losing streak, November 20, 2026
- Investing.com, Fed hike odds at 88% after hot CPI, November 10, 2026
- Reuters via Investing.com, SEC's Nvidia probe examines potential accounting issues, November 20, 2026
- AP via AJC, market close, November 13, 2026
- Motley Fool, stock market today, November 20, 2026
- Noctaaa, daily brief, November 21, 2026
- USPress, US stock market weekly update, week ending November 20, 2026
This is not financial advice.
More from Markets
Nvidia guarantees $108.5B. One person now signs for all of it.
Colette Kress certifies Nvidia's November 17 report as both CEO and CFO. Read the $108.5 billion in guarantees and $279 billion in supply deals she signs for.