
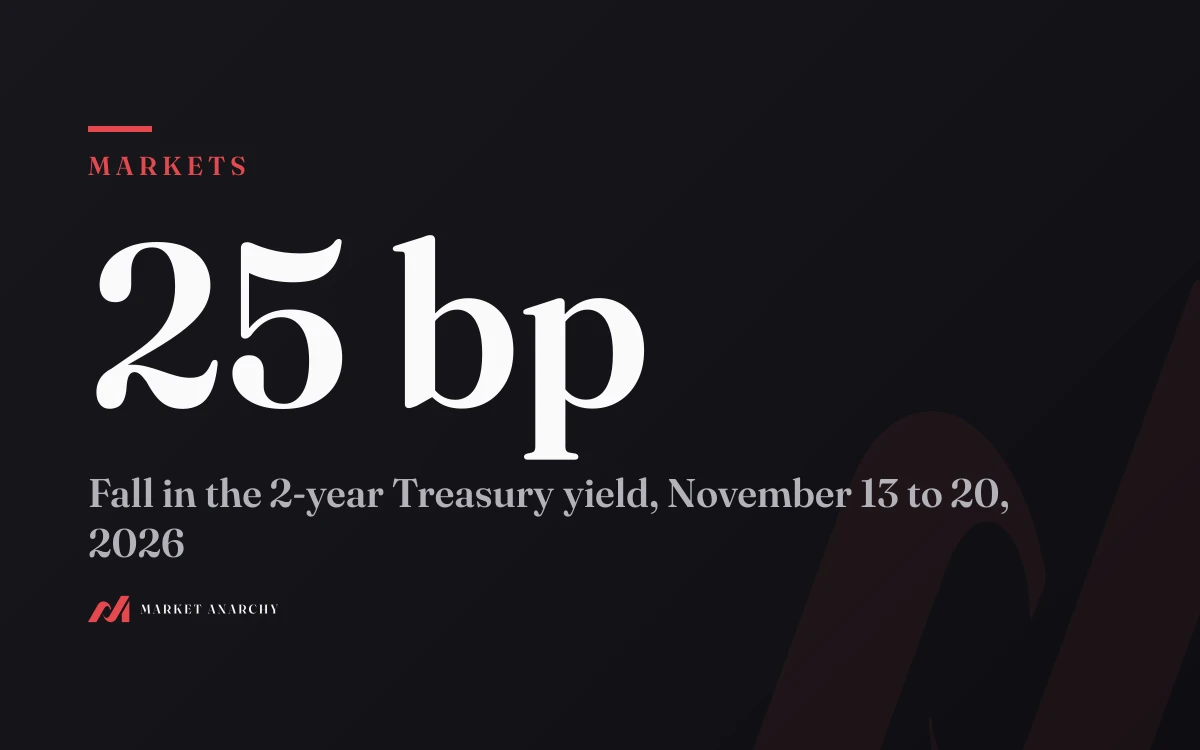
The 10-year nears 2007's 5% record with the Fed 1.4 points lower
The 10-year closed above 5% for the 27th time in 2026, two short of 2007. The New York Fed's model says it's the same bond. The Fed's rate is what moved.
By the numbers
27 of 2910-year closes above 5% in 2026, against 2007's record
3.88%the Fed's effective rate today, against 5.26% on 2007's 5% days
4.35%average Fed rate the 10-year prices over a decade, New York Fed model (2007: 4.47%)
0.74 ptsthe 10-year's term premium in the same model (2007: 0.68)
The 10-year Treasury closed above 5% on November 17 for the 27th time this year, Bloomberg reported, two closes short of the 29 it logged in 2007. Split the yield with the New York Fed's own model and the two runs are close to the same bond. In both, the 10-year prices an average Fed rate of about 4.4% over the next decade, plus about 0.7 points for the risk of lending that long.
The Fed is what moved. On 2007's days above 5%, the effective federal funds rate averaged 5.26%. On November 16 it was 3.88%.
So the same 5% carries opposite bets. In 2007 the bond sat under the Fed and priced cuts. In 2026 it sits 1.3 points over the Fed and prices hikes the Fed hasn't made. For a borrower waiting on mortgage rates, or a saver weighing T-bills against a long bond, that's the useful part: the hikes are already in the 10-year's price, and a Fed meeting that delivers them gives the yield little new to absorb.
How the two runs above 5% compare
Both runs come from the Treasury's daily closing yields, which FRED carries. The averages are ours, taken over each year's closes above 5% (through November 16 for 2026).
| 2007 | 2026 | |
|---|---|---|
| Closes above 5% | 29, June 7 to July 19 | 27, since September 16 |
| Highest close | 5.26%, June 12 | 5.31%, October 5 |
| 10-year, average on those days | 5.12% | 5.17% |
| Effective fed funds, average | 5.26% | 3.87% |
| 2-year, average | 4.95% | 4.81% |
| 30-year, average | 5.21% | 5.51% |
Bloomberg puts the 2007 high at 5.32%, a different price series from the Treasury's closing curve. On the closing curve, 2026 already went higher than 2007 did.
The 2-year barely differs. The gap opens at both ends. In 2007 the whole curve, overnight money to 30 years, sat inside 0.35 points. In 2026 it climbs 1.6 points from the Fed's rate to the 30-year.
What the New York Fed's model finds inside the 5%
The ACM model, published by the New York Fed, splits a Treasury yield in two. One piece is the average short-term rate investors expect over the bond's life. The other is the term premium: the extra a buyer demands for tying money up that long instead of rolling it overnight.
Over 2007's run, the model put the expected rate at 4.47% and the term premium at 0.68 points. On November 16, 2026, it put them at 4.35% and 0.74. The Fed Board's own model, Kim-Wright, reads the premium higher, 0.87 points then and 0.99 on November 13, but it agrees on the change: the premium moved 0.06 to 0.12 points between the two runs.
5.26%4.47%4.35%3.88%
View as table
| label | The Fed's rate and the rate the 10-year expects |
|---|---|
| Fed funds, 2007 run | 5.26% |
| Rate the 10-year expected, 2007 | 4.47% |
| Rate the 10-year expects, Nov 2026 | 4.35% |
| Fed funds, Nov 2026 | 3.88% |
Those are model estimates, fitted to yields. Nobody observes a term premium directly. Two different models landing on the same shape is what makes the reading worth using.
The term premium is in the 5%, and it was in 2007's too
The common story for 2026's yields is a rising term premium, fed by federal deficits and by AI companies selling bonds, a case Bloomberg's coverage repeats. The premium did climb. ACM's reading hit 0.99 points on October 7, its highest since June 2014.
It has since come back to 0.74, within 0.06 of where it sat in 2007. The piece that separates the two runs is the expected rate measured against the Fed. In 2007 investors expected the Fed to average 0.8 points under its 5.26% over the decade, and the Fed began cutting that September. In 2026 they expect it to average about 0.5 points over its 3.88%.
That 0.5 comes from hikes. Futures price a quarter-point increase at the December 9 meeting at 95%, CNBC reported on November 17, and more than 0.80 points of tightening through September 2027, up from about 0.50 earlier, per Bloomberg. The current target range is 3.75% to 4.00%, held at the October 28 meeting with two dissents for a hike.
Add 0.80 to 3.88 and the Fed reaches about 4.7% next year. The 10-year expects 4.35% on average for the decade. Read together, the bond prices hikes first and cuts later.
Why a Fed hike may leave the 10-year where it is
If the Fed hikes on December 9 as priced, the expected-rate piece has nothing new to take in. The 10-year moves when the expected path or the premium shifts, and the last two months show both.
- Down: in the early-November tech selloff the 10-year closed at 4.86% on November 6. ACM had the premium at 0.64 and the expected rate at 4.22 that day.
- Back up: after October's inflation report and October retail sales, which rose 0.6% excluding gas and autos against a 0.4% forecast (CNBC), it closed at 5.12% on November 16, with the expected rate at 4.35.
St. Louis Fed President Alberto Musalem said the Fed may need to hike as many as four more times, CNBC reported on November 17. Four quarter points would take the Fed past what futures price. That is the path that lifts the 10-year's expected rate, and with it the yield.
Inflation expectations alone don't explain the 5%. The 10-year breakeven was 2.21% on November 17, against 2.40% over 2007's run. The real 10-year yield was 2.92% on November 16, against 2.71%. Buyers expect less inflation than in 2007 and demand a higher real return.
What it means for a mortgage, cash, and a bond fund
The 30-year fixed mortgage averaged 7.11% in Freddie Mac's November 12 survey, against 6.67% over 2007's run. The mortgage sits about 2.0 points over the 10-year now, against about 1.5 then; our guide to what mortgage-backed securities yield covers who sets that spread. A buyer waiting for the Fed to bring mortgage rates down is waiting on the wrong lever. Mortgages follow the 10-year, and the 10-year already priced the hikes.
Cash follows the Fed. T-bills track the policy rate and rise with each hike; our guide to T-bills against a savings account has the after-tax numbers. Locking in 10 years at 5.1% pays about 1.2 points over overnight money today. Roughly 0.74 of that is the term premium. The rest pays for hikes that haven't happened.
A bond fund holds the risk on both pieces. Inflation bets carried part of the climb when the 10-year hit 5.29%, as we covered then. Today the expected-rate side is doing more of the work.
What could prove this wrong
The two models disagree on the premium by about 0.25 points, and both are estimates. If deficits or AI bond sales push the premium back to October's 0.99 and keep it there, the 2026 run stops resembling 2007's and the premium becomes the larger story. And if the Fed stops after one hike, the expected rate falls toward the Fed, and the 10-year with it, without any change in the premium.
What to watch
- The FOMC minutes from October 28, due November 18: whether more members than the two dissenters leaned toward a hike.
- The December 9 decision, priced at 95% for a quarter point.
- Closes 28 and 29 above 5%, which would tie 2007's count.
- ACM's split of the 10-year: a rising expected rate means the market is adding hikes; a rising premium means it's charging more to lend long.
Sources
- Bloomberg: US 10-year yield set for historic run above 5% on Fed rate cycle, November 17, 2026
- BigGo Finance, summarizing Bloomberg: 10-year tops 5% for 27th day, November 17, 2026
- CNBC: Treasury yields as investors digest retail sales data, November 17, 2026
- FRED: 10-year Treasury constant maturity (DGS10)
- FRED: 2-year Treasury constant maturity (DGS2)
- FRED: 30-year Treasury constant maturity (DGS30)
- FRED: Effective federal funds rate (DFF)
- Federal Reserve Bank of New York: ACM Treasury term premia
- FRED: Kim-Wright 10-year term premium (THREEFYTP10)
- FRED: 10-year breakeven inflation (T10YIE)
- FRED: 10-year TIPS yield (DFII10)
- FRED: Freddie Mac 30-year fixed mortgage average (MORTGAGE30US)
- Federal Reserve: FOMC statement, October 28, 2026
This is not financial advice.
More from Markets
Nvidia guarantees $108.5B. One person now signs for all of it.
Colette Kress certifies Nvidia's November 17 report as both CEO and CFO. Read the $108.5 billion in guarantees and $279 billion in supply deals she signs for.